
Wasted room capacity is a major problem in hospital surgery departments. In most facilities, OR utilization hovers around 60%. Practically speaking, that means between one-quarter and one-third of expensive OR time is going to waste. Inefficiency at this scale is clearly a financial problem. As hospitals struggle to absorb volume losses related to COVID-19, capacity waste adds to costs while holding back revenue.
Wasted OR time also creates people problems. For surgeons, time inefficiency means frustrating case delays and difficulty accessing the schedule. For anesthesia providers, it means long downtime between cases and the need for a hospital stipend to ensure anesthesia availability. For nurses, it means frequent last-minute shift changes and unexpected late hours.
It is easy to spot efficiency problems after the fact. Every OR manager can look back at the end of a shift and identify delays, downtime, and schedule collisions. The challenge is learning how to proactively identify capacity waste and implement changes to prevent it.
The key to achieving this goal is data analytics. Leading surgery departments are now using advanced analytics to identify the sources of lost OR time. This allows OR management to optimize staff schedules, control costs per case, maximize surgeon access, and increase department revenue.
Why standard data falls short
One of the original selling points of electronic medical record (EMR) systems was the promise of data-driven decision making. Many hospital administrators and OR leaders expected EMRs to provide reliable and valid data that could be used to generate useful reports and facilitate business decisions.
The reality is that although EMRs can aggregate data, they cannot provide in-depth analytics without extensive customization. As just one example, an EMR system’s standard OR utilization report is basically a monthly average for the entire department. This is not useful in an OR where the monthly average utilization is 60%, but daily utilization ranges from 40% to 80%. It can be even more difficult to analyze room-level and surgeon-level utilization.
At the industry level, it is clear that perioperative services must make better use of data analytics. The hospital surgery market in the US generates $300 billion annually (about two-thirds of total hospital revenue). Industries much smaller than healthcare adopted advanced analytics long ago. In comparison, the use of data in the OR has not evolved much in decades. Given the scale and importance of hospital surgery, how can we justify our current approach?
The case for data analytics is even stronger at the hospital level. Consider a single OR staffed for 8 hours per day. At 60% utilization, approximately 200 minutes of room capacity are unused each shift. An advanced analytic strategy offers the potential to identify the sources of that wasted capacity, allowing OR leaders to accommodate one additional case per day. At approximately $5,000 revenue per case, that would generate additional revenue of $1.2 million per room per year.
Building blocks of data analytics
The first step in an advanced OR analytics strategy is to lay the data foundation. Standard EMR reports alone are inadequate, but nearly every EMR can collect the accurate raw data needed to build a functional data analytics platform.
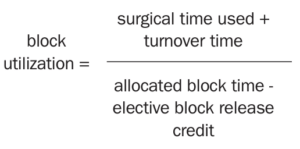
The primary source of data is the EMR intraoperative record, which has time stamps associated with the case ID for all OR data elements. For analytic purposes, the core data points are wheels-in time, case start (cut) time, case end (dressing on) time, and wheels-out time. Other key data elements include surgeon, service, room number, and scheduled case duration. It is important to reach a consensus on how to define key metrics and build those definitions into your system. Definitions should cover case time, turnover time, first-case start time, room utilization, and overall utilization. Additionally, it is critical to establish a standard definition of block utilization. Here is one common approach:
Ideally, the starting dataset will include 12 to 24 months of OR data. OR leaders can then use the dataset to develop a series of analytic reports covering several aspects of department operations.
One of the most useful strategies is to build a report on OR room utilization by hour of day and day of week. Variations include reports on primetime utilization and after-hours (“non-primetime”) utilization as well as block utilization reports for individual surgeons, surgeon groups, and specific departments. OR leaders may also develop a report on utilization by rooms running versus all rooms.
Analytics to maximize productivity
The OR leadership team can use the reports described above to generate insights about the OR schedule and make informed decisions about department operations. Use cases include:
Modifying a fixed daily schedule. Say an OR runs 12 rooms per day. This schedule accommodates surgeon demand, but is this capacity required every day? In many cases, a properly configured primetime utilization report will identify specific days and hours when afternoon demand tapers more quickly than realized. OR leaders might identify specific opportunities to close rooms early or create light schedule days running only 8 or 10 rooms.
Understanding schedule irregularities. Standard EMR reports aggregate utilization data as historical averages. This makes it hard to manage days with schedule irregularities, such as an in-service hour every Wednesday at 7 am. An analytics strategy based on granular hourly data enables OR leaders to exclude irregularities from utilization calculations.
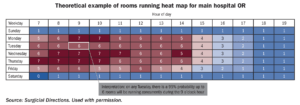
Creating a balanced staffing model. Overtime and PRN hours are generally more expensive than normal shift hours, but there are situations where flexible staffing enables a more efficient schedule. Accurate utilization reports help identify any short schedule pockets that are most efficiently staffed by the PRN pool. These reports can also uncover opportunities to create highly productive 10- or 12-hour blocks. Utilization reports are commonly output in spreadsheet format. For greater usability, work with data support professionals to present information in an accessible graphic format. A sample heat map illustrates how analytics can be displayed graphically to facilitate decision making (sidebar, “Theoretical example of rooms running heat map for main hospital OR”).
Analytics to optimize surgeon access
Surgeon access analysis is similar to the approach described above for staff productivity. Again, the foundation is a baseline of per-hour/per-day data on surgeon utilization. Use cases include:
Streamlining block allocation. Say a standard EMR report shows that Surgeon X’s Tuesday morning block utilization is only 40%. However, the full surgeon utilization report shows that she does many cases on Wednesday and Thursday evenings. Guided by this analysis, the OR leadership team could work with the surgeon to consolidate all her volume to a single properly scheduled block.
Managing block credits. Every OR should have clear guidelines on releasing unneeded block time ahead of the schedule. The OR leadership team can develop several analytic reports that make it easier to enforce the rules and optimize the use of release time. For example, say Surgeon Y is following the rules regarding timely release and therefore maintaining adequate block utilization. However, his release rate is 50%, which strongly suggests the need for less block time.
Managing care sites. Analytics can also help the OR management team identify the most appropriate and costefficient setting for cases. Not all arthroplasty procedures need to be performed in the main OR—many low-risk hip replacements can be done in an outpatient setting. Similarly, not all ENT procedures can be performed in an ambulatory surgery center—patients with certain airway risk factors should undergo surgery in a hospital setting. Leadership teams can use analytics to create reports on productivity, site usage, case complexity, and other clinical factors. Guided by these reports, the team can then work with surgeons to schedule cases for the right setting.
Balancing the anesthesia schedule. One of the challenges of designing an efficient OR schedule is deploying anesthesia resources across hospital OR and non-OR anesthesia (NORA) locations. In most hospitals, a relatively inconsistent anesthesia demand environment has created the need for very expensive supplemental hospital support for anesthesia services. Traditionally, OR scheduling focuses on the hospital surgery department alone. Advanced analytics allow OR management to integrate NORA locations into operational reports. This helps the anesthesiology department visualize demand for services holistically. Once demand for services is well understood, anesthesiology can streamline its operations by refining coverage based on day-of-week and hour-of-day demand. Additionally, advanced analytics can provide recommendations for optimal shifts.
Knowing the optimal mix of 8-, 10-, and 12-hour shifts allows anesthesiology departments to better manage daily staffing, provide more effective coverage across departments, and recruit and retain talent more effectively. Using analytics to improve anesthesia productivity can greatly reduce the need for a hospital stipend.
The benefits of data analytics are clear. Advanced analytic tools can help OR leaders drive down cost per case. In addition, a more granular view of utilization across the schedule can help the leadership team identify many opportunities to accommodate additional cases.
Data analytics may sound like a high-tech strategy, but it is equally a “high-touch” process that demands the active involvement of all stakeholders.
It is important to develop a leadership team of surgeons, anesthesiologists, nurse managers, and senior administrators to regularly review OR data and analytics.
A multidisciplinary team is essential to monitoring utilization to identify the full range of issues that lead to wasted capacity. A team approach is also required to improve surgeon access to the OR in a way that predictably optimizes productivity of expensive surgical services. The ultimate goal is to balance the needs of all stakeholders and build a more productive access model that minimizes waste, achieves high OR utilization, and drives strong OR revenue.